
Evaluating the accuracy of AI models is critical for ensuring that they are effective in solving real-world problems. Accuracy is a measure of how well a model predicts the outcome of unseen data. In this blog post, we will discuss how to evaluate the accuracy of AI models and the metrics used to measure them, with examples to illustrate their applications.
Confusion matrix
A confusion matrix is a table that shows the number of correct and incorrect predictions made by a model for each class. It is a useful tool for evaluating the accuracy of binary classification models, where there are two possible outcomes.
The confusion matrix has four entries: true positives (TP), false positives (FP), true negatives (TN), and false negatives (FN). TP and TN represent correct predictions, while FP and FN represent incorrect predictions.
By analyzing the confusion matrix, we can calculate several metrics that provide insight into the accuracy of the model. These metrics include precision, recall, F1 score, and accuracy.
For example, if a model correctly predicts 90 out of 100 positive cases, and incorrectly predicts 10 negative cases as positive, the precision score is 90/100 = 0.9.
Precision
Precision is a metric that measures the proportion of true positives (TP) out of all predicted positives (TP + FP). A high precision score indicates that the model is making few false positive predictions.

For the example above, the precision score is calculated as 150 / (150 + 50) = 0.75. This means that 75% of the customers predicted to churn by the model actually churned.
Recall/Sensitivity/True Positive Rate
The recall is a metric that measures the proportion of true positives (TP) out of all actual positives (TP + FN). A high recall score indicates that the model is correctly identifying a high proportion of positive cases.
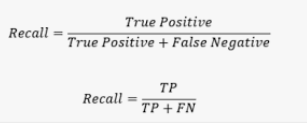
For the example above, the recall score is calculated as 150 / (150 + 100) = 0.6. This means that the model correctly identified 60% of the customers who actually churned
Specificity
Specificity is another metric used to evaluate the accuracy of AI models. It measures the proportion of true negatives (TN) out of all actual negatives (TN + FP). A high specificity score indicates that the model is making a few false negative predictions.
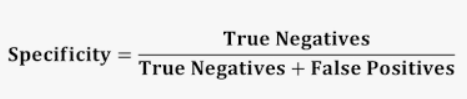
For the example above, the specificity score is calculated as 980 / (980 + 20) = 0.98. This means that the model correctly identified 98% of the non-spam emails.
It is worth noting that specificity and sensitivity (recall) are complementary metrics that need to be evaluated together to assess the overall accuracy of a model. In some cases, a model may have high sensitivity but low specificity, which means that it identifies many true positives but also many false positives. In other cases, a model may have high specificity but low sensitivity, which means that it correctly identifies many true negatives but also many false negatives.
F1 score
The F1 score is a metric that combines precision and recalls into a single score. It is calculated as the harmonic mean of precision and recall, and ranges from 0 to 1, with a higher score indicating better performance.
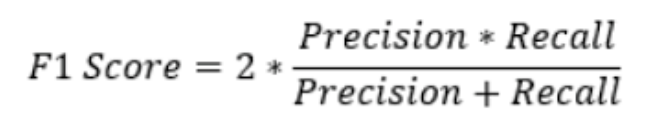
For the example above, the F1 score is calculated as 2 * (0.75 * 0.6) / (0.75 + 0.6) = 0.67.
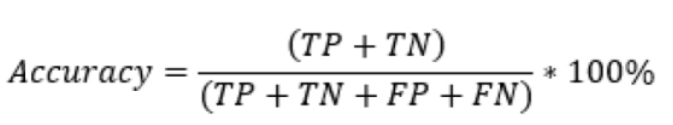
Accuracy
Accuracy is a metric that measures the proportion of correct predictions made by the model out of all predictions. It is calculated as (TP + TN) / (TP + FP + TN + FN) and ranges from 0 to 1, with a higher score indicating better performance.
For the example above, the accuracy score is calculated as (700 + 150) / (700 + 50 + 100 + 150) = 0.85.
While accuracy is a useful metric, it can be misleading in cases where the dataset is imbalanced, i.e., when the number of positive and negative cases is significantly different. In such cases, other metrics such as precision and recall may provide more meaningful insight into the accuracy of the model.
Precision-Recall or PR curve
The precision-recall curve is a graph that shows the relationship between precision and recall for different threshold values. The ideal scenario is to achieve high precision and recall at the same time, which is shown in the top right part of the graph. , there are six predictors, and each predictor has its own precision-recall curve for various threshold values. Depending on the application, we can choose the best predictor and threshold value that meets our requirements.
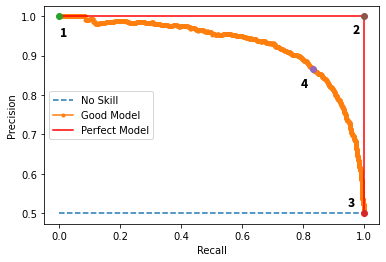
The PR AUC (Precision-Recall Area Under Curve) is a numerical value that represents the area under the precision-recall curve. The higher the PR AUC value, the better the performance of the predictor.
Both metrics are widely used to judge a model’s performance. The evaluation metric to use depends heavily on the task at hand.
Receiver Operating Characteristic (ROC) curve
The ROC curve is a graphical representation of the performance of a binary classification model. It plots the true positive rate (TPR) against the false positive rate (FPR) at various threshold settings.
The TPR represents the proportion of actual positives that are correctly identified as positive by the model, while the FPR represents the proportion of actual negatives that are incorrectly identified as positive by the model
FAQs